Hopedale in Some Newspaper Stories

I spotted a couple of interesting mentions of Hopedale in newspaper stories via my saved Google news searches. The first is an article in the Cape Cod Times by Rev. Robinson:

The theory of nonviolence has its roots in the ethic of Jesus, but as a technique for social transformation, it began with a Universalist minister, Adin Ballou, in the mid-19th century here in Massachusetts. Ballou was the spiritual head of a utopian community in Hopedale, located in the Blackstone River Valley. He was a Christian socialist, and when many of his fellow socialists were advocating violent means in the struggle against capitalism, Ballou championed nonviolence.

Ballou was Leo Tolstoy’s favorite American author, and Tolstoy took up Ballou’s ideas of nonviolence. Mohandas Gandhi, in turn, read Tolstoy, and Martin Luther King Jr. read Gandhi.

I was not aware of the Rev. Ballou’s influence on Tolstoy’s thinking.

The other story is sad, it’s by Joe O’Connell of the Milford Daily News, “Developmentally disabled from Hopedale clubhouse to protest cuts to clubhouses”. It makes me sad that we are reducing our level of help to our most vulnerable citizens.

BRVNHC Review

Mike of the Further In & Higher Up blog has over a hundred posts about National Park Service places. Last month he posted about his experiences in the Blackstone River Valley National Heritage Corridor. It’s a good read I recommend it. He gives the BRVNHC an overall rating of 3 out of five “very interesting”, better than average. I was a little surprised that Slater Mill wasn’t suggested as the place to start a tour when he was at the Roger Williams National Memorial. I suspect if he had visited Slater Mill the “Significance” rating of 2, “debatable that this had to be preserved” might have been higher.

Google Earth News & Map Data Sources

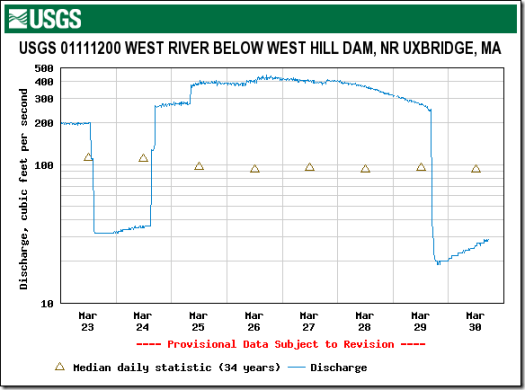
I’ve been using Google Earth version 5.2.1.1329 (beta) for some time and I find the measurement tab of the path properties dialog very useful. Another very handy feature appears when you right click on a path, the Show Elevation Profile option creates a nice interactive elevation chart.


I stumbled upon a good resource for free online historical maps the other day, Maps ETC from the University of South Florida. In addition to the nice maps they also provide some good basic tutorial videos for Google Earth.


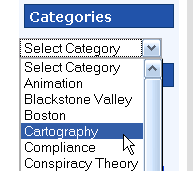
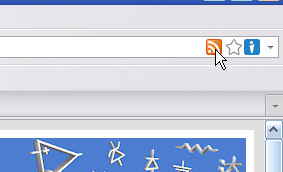
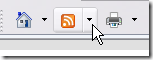
While I was updating some of my Blackstone Valley places files I discovered the Map of all coordinates from Google link on a Wikipedia National Register of Historic Places list article. Clicking the link plots all the sites in Google Maps, but if you click the show link over to the right you get more mapping options. One of the options, Export all coordinates as KML, lets you load the place locations directly into Google Earth.

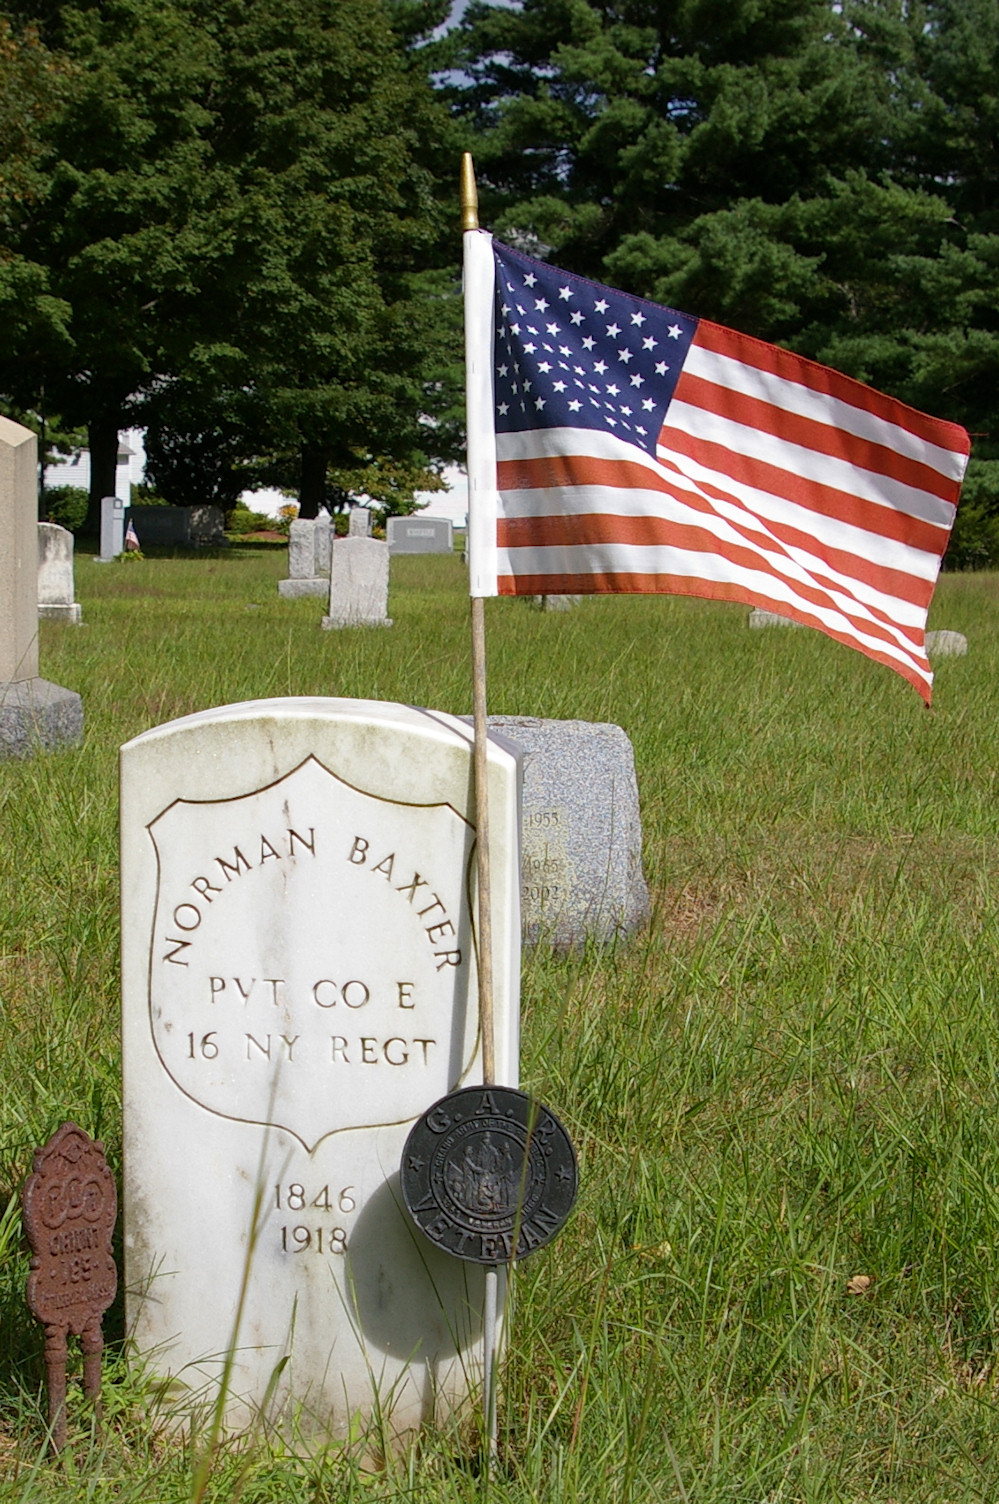
I decided to load up all the Wikipedia data for Massachusetts and Rhode Island, wow, there are a lot of sites. So I made a version limiting the places to those that fall within the boundary of the Blackstone River Valley National Heritage Corridor.

Most of the sites are not positioned precisely so, I’m tweaking the positions as I work on exploring the BRVNHC. During a recent editing session I found that the National Register of Historic Places provides Google Earth files with some locations updated with more accurate TeleAtlas data. Loading these files along with my my custom file helps in locating the historic sites.

One feature I’m editing into the files I have not found a way to do through GE itself. This is setting the placemark style variations for normal versus highlighted. I’ve set the style so that normally there is no label but when you point to the placemark the label appears and the icon grows. You get this effect by setting up the style block like this:

<StyleMap id="msn_star">
    <Pair>
        <key>normal</key>
        <styleUrl>#sn_star</styleUrl>
    </Pair>
    <Pair>
        <key>highlight</key>
        <styleUrl>#sh_star</styleUrl>
    </Pair>
</StyleMap>
<Style id="sn_star">
    <IconStyle>
        <Icon>
            <href>http://maps.google.com/mapfiles/kml/shapes/star.png</href>
        </Icon>
    </IconStyle>
    <LabelStyle>
        <scale>0</scale>
    </LabelStyle>
</Style>
<Style id="sh_star">
    <IconStyle>
        <scale>1.2</scale>
        <Icon>
            <href>http://maps.google.com/mapfiles/kml/shapes/star.png</href>
        </Icon>
    </IconStyle>
</Style>

With no scale parameter specified for an IconStyle the default value is 1, and with no LabelStyle parameter the label scale defaults to 1.

Aggregating and Filtering Web Sources

Trying to keep up with information on a topic via web sources is time consuming. While RSS feeds make it easier to find just the new information, there is still a lot of wasted time when feeds contain additional topics that don’t interest you. The solution is to filter feeds so that only the topic of interest is included. Some blogs allow you to filter the content by providing separate RSS feeds for each category of posts. Here’s how to get a feed of just the cartography category from this blog.

  1. Select the category you want from the dropdown list in the right sidebar.
    RSSfilter1 RSSfilter2
  2. Select the category feed from the RSS selector icon (Firefox on left, Internet Explorer on right).
    RSSfilter3F RSSfilter3IE
    RSSfilter4F RSSfilter4IE
  3. Finally, subscribe to the selected feed with your favorite feed reader, I use Google Reader. To follow other categories from the blog simply repeat these steps.

This works well for RSS sources that have category, tag or label specific RSS options, but many sites don’t have this feature. For sites without the feature you can use the filtering power of Yahoo! Pipes. Take a look at this Pipes filtered feed I created for a Blogger hosted Blog. Yahoo! Pipes provides an RSS feed of the output (as well as many other formats) that you can subscribe to in a feed reader.

Filtering feeds saves me time, but my feed reader still has too many items in the subscription list. Organizing my subscriptions by creating folders for topics in Google Reader helps reduce visual clutter and allows me to ignore less important topics when I’m busy. A more effective way of dealing with the long list is to aggregate multiple feeds with a Yahoo! Pipe. For example I have a single subscription to a pipe that combines 15 different sources about the people of, and places in, the Blackstone River Valley.

The Blackstone River Valley pipe aggregates these feeds:

If you know of other sources that belong in this pipe please leave a comment or send me an email. You may also like this aggregation of Blackstone Valley photos from five Flickr feeds.

One final note about Yahoo! Pipes, they don’t always seem to run completely when Goggle Reader first queries them (I think it’s a timeout issue). So I make it a habit to click on the pipes subscriptions occasionally even when there are no new items indicated. This sometimes finds updates to the pipe feed that were missed during previous polling by Google Reader.

Thank You Army Corp of Engineers

If you’ve been following the news from New England you are aware that a major flood event is in progress. This morning the NECN weatherman Matt Noyes said that this was the worst flooding we’ve had since the floods of August 1955. This got me thinking about the West Hill Dam in Uxbridge and how we southern New Englanders should all thank the Army Corps of Engineers. They built the dam specifically to prevent the devastation and loss of life that happened in 1955. Looking at the records since then I feel that this dam has been a resounding success. Since its completion in 1961 the floods on the Blackstone have been controlled to less than 16 feet at Woonsocket as opposed to the nearly 22 foot record from 1955. Predictions from the NWS are for 18 feet in Woonsocket for this current flood, well below the extremely dangerous 22 feet that caused so much loss of life. UPDATE 3/30 22:30 Forecast has been lowered to 14 feet @ Woonsocket

The main reason we are so much safer now is the Army CoE’s excellent design and operation of the West Hill Dam. As you can see in this graph, yesterday afternoon they closed the gates of the dam stopping the entire West River from adding to the Blackstone’s flood level.

USGS20100330

This activation of the dam is going to change the look of the dam area from what we usually see in this Google Maps satellite view.

To what is in this photo from the West Hill Dam web site.

WestHillDamPhoto

More information:

USGS WaterWatch — Maps and graphs of current water resources conditions

Worcester Telegram & Gazette’s Weather notebook – Rivers rise as rain falls

Site Updates

I’ve posted some major updates to the Blackstone River section of my web site. On the Google Earth page I’ve updated the National Park Service tours file and added a file with the 1913 map of the Hopedale Parklands as an overlay in GE. The visitor tips page has a new section covering the few minor natural hazards in the valley (insects, plants, animals).

I wrote an extensive article on the George Washington Presidential Trail which runs through the center of the valley. The article describes the trail and also tries to sort the legends into facts and myths based on historical and geographic research.

The tours file mentioned above was updated based on completing seven of the walking tours this year. The seven tours I took were Arnold Mills, Blackstone Canal, Grafton, Hopedale, Mendon, Upton and Whitinsville. The tours page has been updated with links to the photos I took on these tours. I’ve completed writing reviews for the Mendon and Hopedale tours. In addition to reviewing the tours I also used my history and geography geek skills to research and correct misleading and questionable information from the tours. While taking these tours I shot some new good photos of plants and animals I encountered, they are in the plants and animal sections of my web photo album.